Disclosure: Microgreens Guru may earn a commission if you buy through some links on this page, at no extra cost to you.
Yes, microgreens fit almost any keto or low carb limit. In the one lab study that measured carbohydrate across 14 crops, the highest was mung bean at 7.16 g per 100 g, which means a large 50 g serving holds at most 3.58 g of net carbs, and a 10 g garnish at most 0.716 g. The lowest, red cabbage, comes to at most 1.16 g in 50 g. Those are ceilings rather than exact net carb figures, and the reason matters for how you log them, so here is how to count a serving against your own daily number.
What your daily limit actually is
Before a serving of anything can "fit," you need the number you are counting against, and the sources you are likely to follow don't all use the same one.
- Ketogenic, strict end. The JAMA patient page on ketogenic diets (Li and Heber, UCLA Center for Human Nutrition, 2020) describes a ketogenic diet as restricting carbohydrate to less than 25 to 50 g a day. Harvard's Nutrition Source says ketogenic diets typically bring total carbohydrate below 50 g a day, sometimes as low as 20 g.
- Low carb, broader. Mayo Clinic says low carb diets commonly allow 60 to 130 g a day, and very low carb diets use less than 60 g. The Obesity Medicine Association's 2022 clinical practice statement (Alexander et al.) describes low carbohydrate as often 50 to 150 g a day and very low carbohydrate as often below 50 g.
If you are on strict keto, the number to test a serving against is somewhere between 20 and 50 g. If you follow a looser low carb plan, it could be anywhere up to 130 or 150 g. Use whichever figure you actually track, and work the arithmetic below against it.
Why you get a ceiling, not a net carb number
Net carbs are total carbohydrate minus dietary fiber. To get a true net carb figure for a crop, you need both numbers measured on the same sample. No study in the published research has done that for a microgreen, so there is no matched net carb figure for any crop yet.
What does exist is a solid carbohydrate dataset. Kowitcharoen and colleagues at King Mongkut's University of Technology Thonburi, publishing in Applied Sciences in 2021, grew 14 microgreens in soilless trays in Bangkok at 23 °C and 65% relative humidity, harvested them between 4 days (mung bean) and 10 days after sowing, and analyzed them fresh, as you would eat them. They worked out total carbohydrate "by difference": they measured water, protein, fat and ash, and counted whatever was left as carbohydrate. Fiber was not reported separately.
That method is the useful part for you. Because fiber was never taken out, it is still sitting inside each carbohydrate figure. Whatever the fiber content really was, the net carbs can only be the same as the total or lower. So, each total works as a ceiling: the most net carbs that crop could have held in that study. Counting the total is the conservative choice, and on keto conservative is usually what you want.
One thing to keep in mind: the study used duplicate trays per crop, so each figure rests on a small sample, and your own seed, medium and harvest day will differ. Treat the numbers as a close guide rather than your tray's exact content.
Net carb ceilings for 14 crops
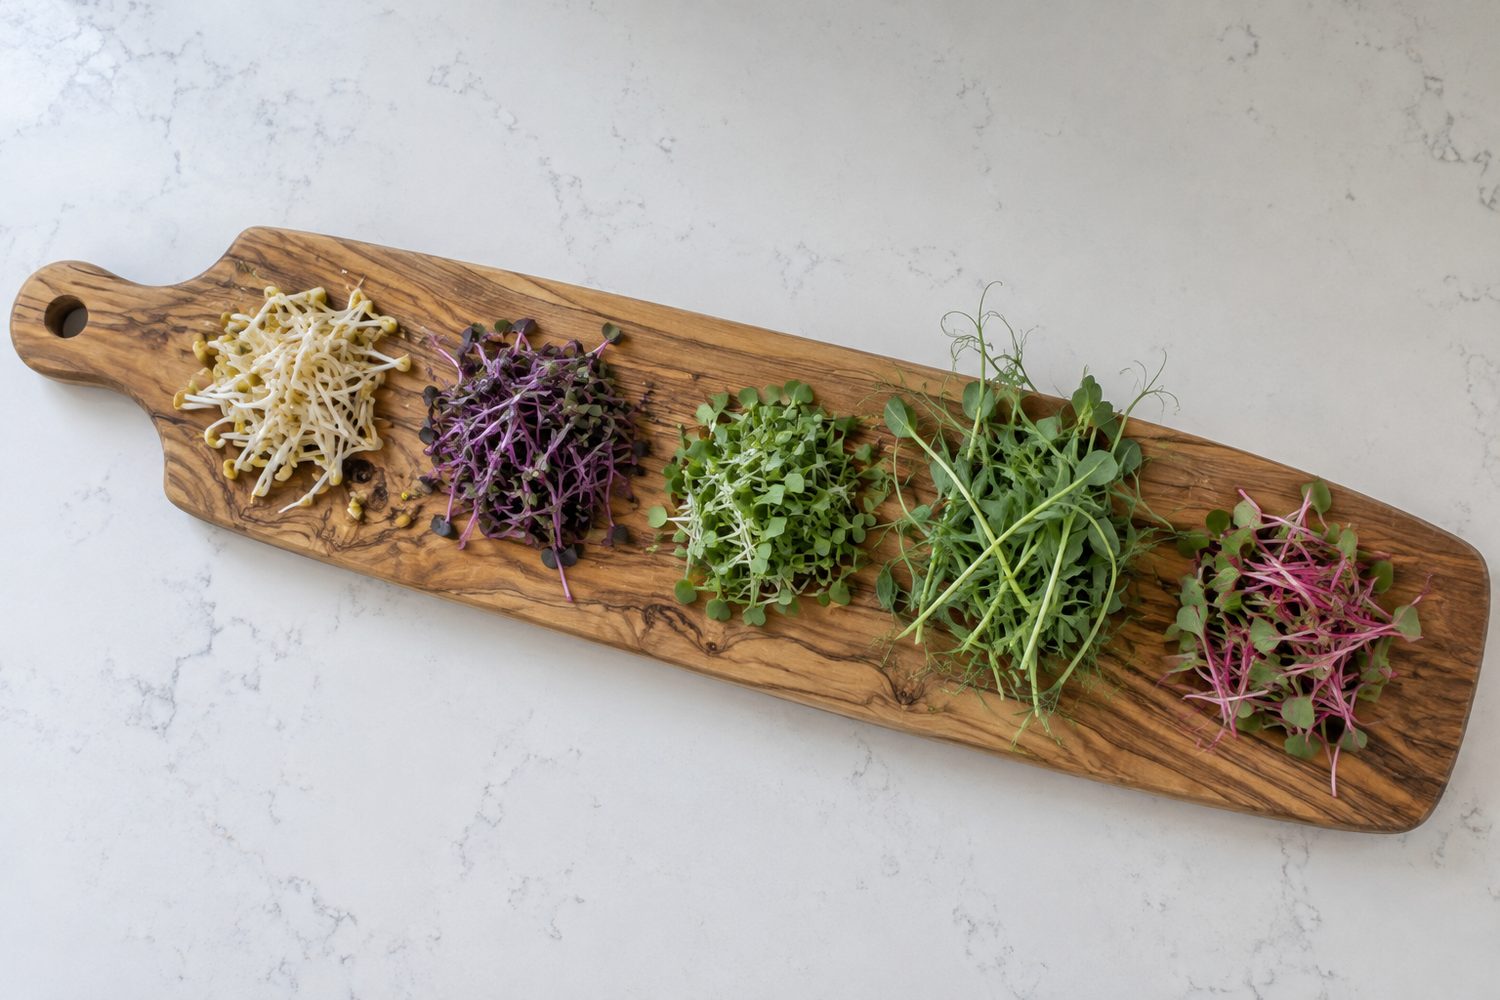
These are the Kowitcharoen 2021 totals per 100 g fresh weight, with the ceilings worked out for a 10 g garnish and a generous 50 g serving. For help judging what a realistic portion looks like, see microgreens serving size and cost.
Hover or tap a row to highlight it.
| Crop | Total carbohydrate, g per 100 g | Net carb ceiling, 10 g serving | Net carb ceiling, 50 g serving |
|---|---|---|---|
| Red cabbage | 2.32 | 0.232 g | 1.16 g |
| Red roselle | 2.51 | 0.251 g | 1.255 g |
| Broccoli | 2.70 | 0.270 g | 1.35 g |
| Rat-tailed radish | 2.91 | 0.291 g | 1.455 g |
| Morning glory | 3.08 | 0.308 g | 1.54 g |
| Chinese kale | 3.13 | 0.313 g | 1.565 g |
| Radish | 3.29 | 0.329 g | 1.645 g |
| Green pea | 3.39 | 0.339 g | 1.695 g |
| Black sesame | 3.58 | 0.358 g | 1.79 g |
| Purple radish | 3.70 | 0.370 g | 1.85 g |
| Buckwheat | 4.90 | 0.490 g | 2.45 g |
| Fenugreek | 5.12 | 0.512 g | 2.56 g |
| Lentil | 5.92 | 0.592 g | 2.96 g |
| Mung bean | 7.16 | 0.716 g | 3.58 g |
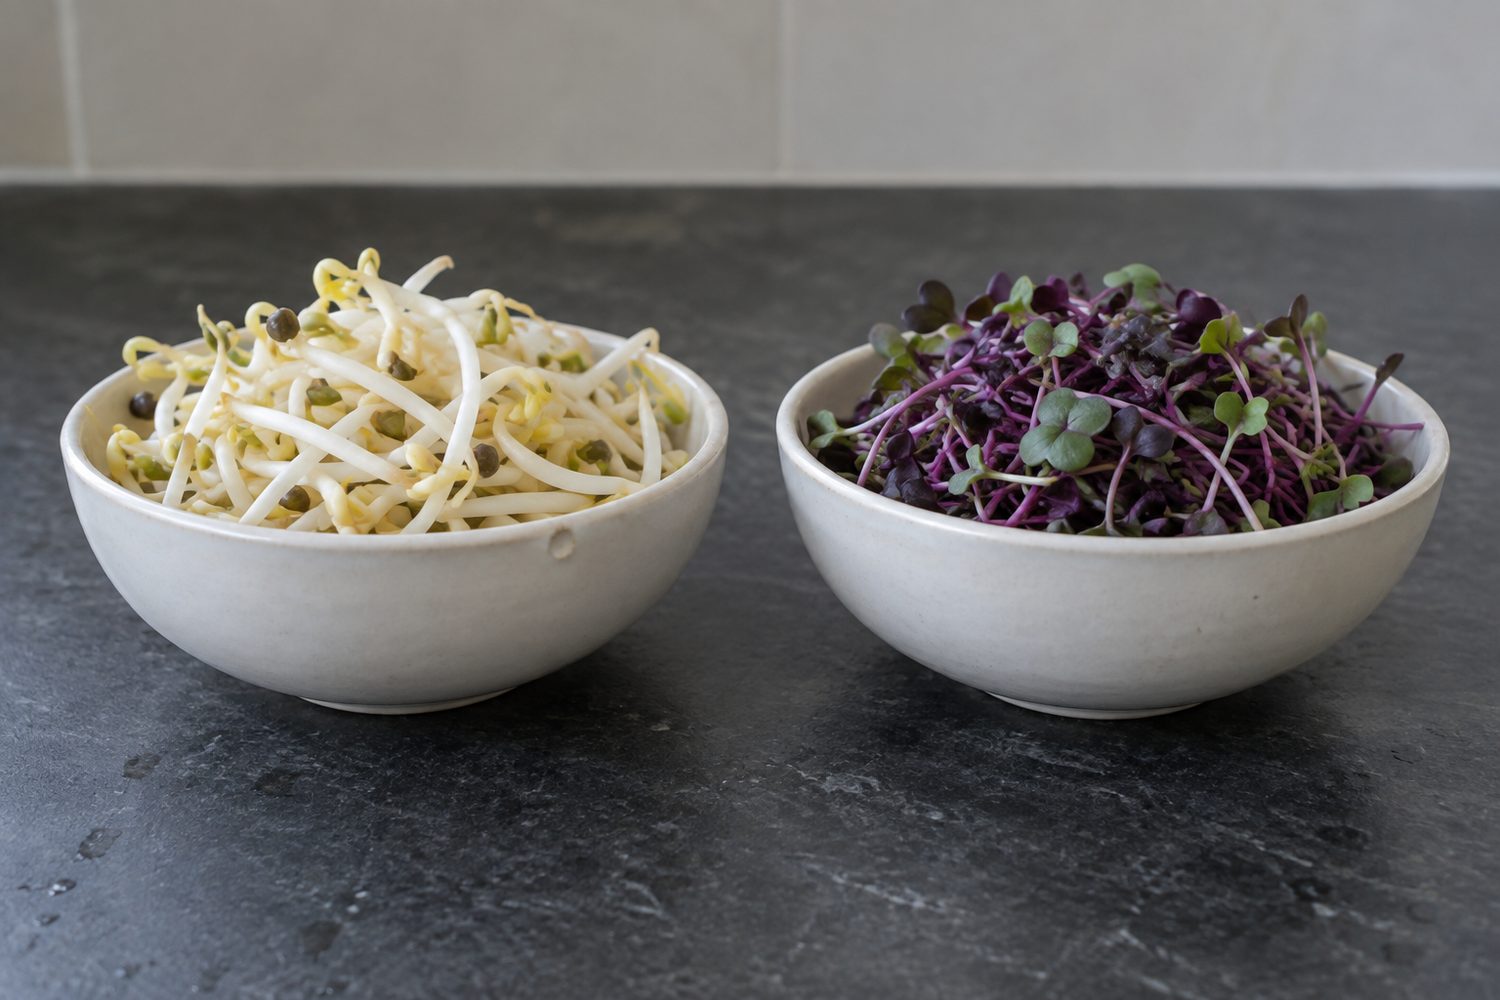
The pattern among these 14 is that the brassicas (red cabbage, broccoli, the radishes, Chinese kale) sit at the low end, and the legumes and seed crops (lentil, mung bean, fenugreek, buckwheat) sit at the high end. Green pea is the exception among the legumes at 3.39 g. That pattern holds for the crops tested; it doesn't prove that every large-seeded microgreen runs higher. Sunflower wasn't in the study at all.
Putting a serving against your limit
Take the worst case first. A 50 g serving of mung bean microgreens, which is a big salad's worth, holds at most 3.58 g of net carbs.
- Against a 20 g strict keto limit, that is at most about 18% of your day.
- Against 25 g, the low end of JAMA's range, at most about 14%.
- Against 50 g, the upper end of JAMA's and Harvard's keto ranges, about 7%.
- Against Mayo Clinic's 60 to 130 g low carb range, about 6% at the bottom and under 3% at the top.
Now the best case. A 50 g serving of red cabbage microgreens holds at most 1.16 g, under 6% of a 20 g day. A 10 g garnish of red cabbage is at most 0.232 g, which barely registers on any tracker.
The only place microgreens take a noticeable share of a day is the combination of a strict 20 g limit, a large serving and one of the higher crops. If you are eating large amounts every day, how much microgreens per day goes through what a sensible daily amount looks like.
To count your own serving, weigh it. A kitchen scale that reads to the gram is the one tool that makes this exact. Multiply the grams you are eating by the crop's figure in the table and divide by 100. For 30 g of broccoli microgreens, that is 30 × 2.70 ÷ 100 = 0.81 g at most.
If your crop isn't in the table
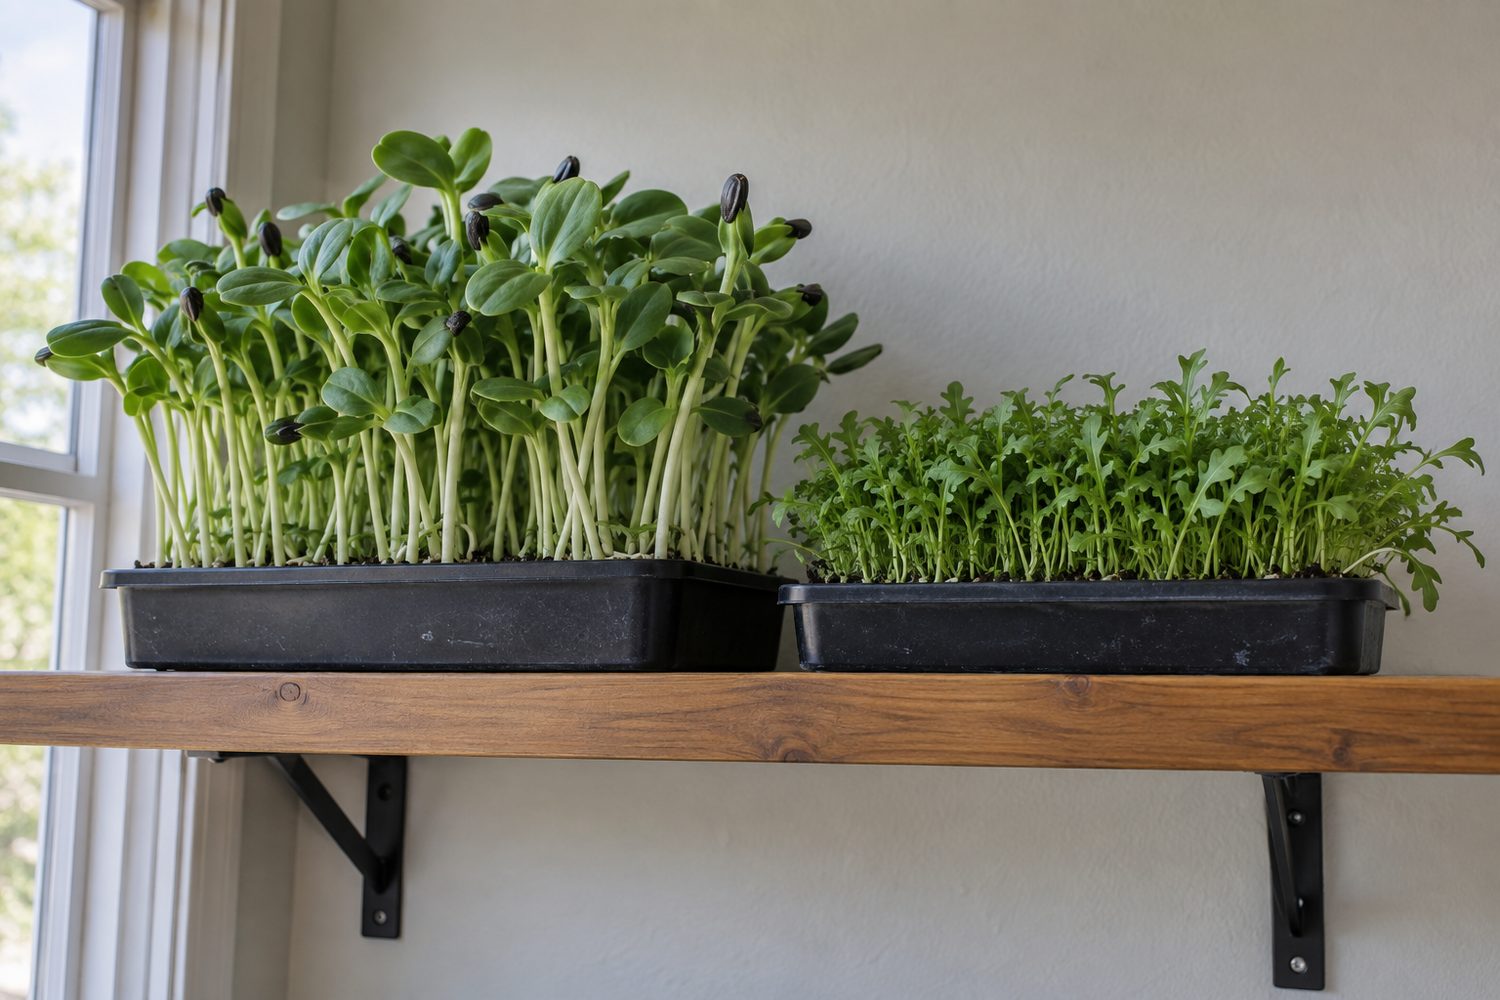
Sunflower and many common home crops, such as arugula, mustard and amaranth, have no measured carbohydrate figure alongside the crops above. For those, you have two practical options.
The first is your package label, if you bought the greens. It gives carbohydrate and fiber per serving, so you can subtract one from the other. Keep in mind that labels round to whole grams per serving, so a small serving can read as 0 g or 1 g when the true figure sits in between.
The second, if you grow your own, is to borrow the nearest crop from the table and use its ceiling. For a brassica such as mustard or arugula, the brassica figures (2.32 to 3.70 g per 100 g) are the closest guide. For a large-seeded crop, using mung bean's 7.16 g as your figure keeps you on the safe side.
USDA FoodData Central, the database most trackers draw from, has no analyzed record for any microgreen crop. Every microgreen entry it holds is a brand's package label or an experimental research record without carbohydrate values. The labels are still useful, as long as you read them as labels:
Hover or tap a row to highlight it.
| Product (label figures) | Carbohydrate, g per 100 g | Fiber, g per 100 g | Net by subtraction, g per 100 g |
|---|---|---|---|
| New Day Farms sunflower microgreens, FDC 2463379 | 6.25 | 3.1 | 3.15 |
| New Day Farms sunflower and basil, FDC 2489897 | 4.42 | 2.2 | 2.22 |
The sunflower and basil label is the source of a figure that gets repeated for microgreens in general: about 4.4 g carbohydrate and 2.2 g net carbs per 100 g. It comes from one brand's rounded package declaration (4 g carbohydrate and 2 g fiber per 90.5 g serving), not a lab analysis, and it describes that mix only.
Sugar in microgreens
Sugar is part of total carbohydrate, so if you track it separately, it is already inside the ceilings above. The measured amounts are small. At least four studies have measured sugars in microgreens.
Xiao and colleagues (USDA Agricultural Research Service and University of Maryland, Postharvest Biology and Technology, 2015) measured fructose, glucose and sucrose in six greenhouse microgreens from a California grower. Their figures are in grams per kilogram. Converted, total sugar ran from 0.17 g per 100 g in red amaranth to about 1 g per 100 g (1.03 g) in China rose radish, with Dijon mustard at 0.77 g, peppercress 0.88 g, bull's blood beet 0.44 g and opal basil 0.2 g.
Wojdyło and colleagues (Molecules, 2020) found no measurable sugars at all in kale, radish, beetroot, green pea or amaranth microgreens: glucose, fructose, sucrose and the other sugars tested were all 0.0 g per 100 g, while sprouts of the same crops held up to 1.8 g.
Paglialunga and colleagues (Frontiers in Sustainable Food Systems, 2023) measured growth chamber radish at about 0.48 g soluble sugars per 100 g plus about 0.19 g starch, and savoy cabbage at about 1.25 g sugars plus 0.52 g starch. The growing medium made a difference: savoy cabbage on cellulose sponge reached about 1.52 g of sugars against 0.98 g on coconut fiber.
Balik and colleagues (Scientific Reports, 2025) also measured sugars in six microgreens, including pea and sunflower, but the paper gives its units two different ways, so its amounts can't be converted to grams with confidence. Use the other three for numbers.
Across all of this, the highest measured sugar content is about 1.5 g per 100 g, which in a 50 g serving is well under 1 g. For what that means for glucose readings, see microgreens and blood sugar.
If you are on a therapeutic ketogenic diet
A ketogenic diet used to manage a medical condition is run to a prescription, and the carbohydrate target and how foods are counted come from your clinician or dietitian. The figures on this page are general food composition data. Take them to your care team and follow their counting method rather than working a medical diet out from a table.
Frequently asked questions
What should I log in my tracking app for microgreens?
Log the crop's total carbohydrate from the table at your weighed serving, which is the conservative ceiling. App entries for "microgreens" are generic: the KetoDiet App lists mixed microgreens at 0.6 g net carbs per ounce (about 28.3 g) without naming its source or a crop, and EatBetter marks microgreens as keto "Suitable" with figures for an unnamed 30 g cup. Those are app entries, not measurements of your crop.
Are microgreens lower in carbs than the mature vegetable?
There is no matched comparison to go on for carbohydrate, so treat any claim either way as unproven. What you can use is the per-crop ceiling above, which is low regardless. Weigh your serving and count it the same way you would count the grown vegetable.
Are pea shoots or sunflower shoots too high for keto?
Green pea microgreens measured 3.39 g carbohydrate per 100 g, in the middle of the 14 crops, so a 50 g serving is at most 1.695 g. Sunflower has only package labels: one brand declares 6.25 g carbohydrate and 3.1 g fiber per 100 g, about 3.15 g net. Either fits a strict keto day at normal serving sizes.
Do microgreens cause digestive trouble on a low carb diet?
Carbohydrate count and gut tolerance are separate questions. If you are also limiting fermentable carbohydrates, check are microgreens low FODMAP before adding a crop in quantity.
What else do microgreens add besides carbs?
Mostly water: the 14 crops in the Kowitcharoen study were 86.57 to 94.67 g water per 100 g. The figures for each crop are in microgreens calories and protein.
The short version
Pick the number you track, weigh your serving, and multiply by the crop's figure from the table. Every crop measured comes in under 3.6 g of net carbs even in a 50 g bowl, and most brassicas come in under 2 g. For a crop that isn't listed, use your package label or borrow mung bean's 7.16 g per 100 g to stay safe. If your keto diet is medical, your clinician sets the count.
Sources
Prices, stock and specifications are as the linked pages showed them on 2026-09-26.
- JAMA patient page on ketogenic diets
- Harvard's Nutrition Source
- Mayo Clinic
- Obesity Medicine Association's 2022 clinical practice statement
- Kowitcharoen and colleagues
- New Day Farms sunflower microgreens, FDC 2463379
- New Day Farms sunflower and basil, FDC 2489897
- Xiao and colleagues
- Wojdyło and colleagues
- Paglialunga and colleagues
- Balik and colleagues
Keep reading
The journal
Best Microgreens for Kidney Health: Potassium by the Serving
See measured potassium and phosphorus for the best microgreens for kidney health, from lowest to highest, plus what your renal dietitian needs to know.
Read Best Microgreens for Kidney Health: Potassium by the ServingThe journal
Are Microgreens Low FODMAP? What Monash Research Shows
Are microgreens low FODMAP? Learn what Monash sprouting research shows, which crop families deserve extra caution, and how reintroduction testing works.
Read Are Microgreens Low FODMAP? What Monash Research ShowsThe journal
High Protein Microgreens: Calories and Protein per Serving
Compare high protein microgreens by crop, with protein and calories per 100 grams and per serving, so you know exactly what ends up on your plate.
Read High Protein Microgreens: Calories and Protein per ServingThe journal
Are Microgreens Anti-Inflammatory? What the Research Really Says
Nobody has fed a person microgreens and measured their inflammation. And when researchers pooled ten broccoli sprout trials, the combined result came out at something that could be zero.
Read Are Microgreens Anti-Inflammatory? What the Research Really Says