Are Microgreens Sustainable? The Published Range Is 3.34 to 63.34 kg CO2e a Kilo, and Your Grid Decides Where You Land
Cal HewittPublished Checked
- selling microgreens
- economics
- growing
- business planning
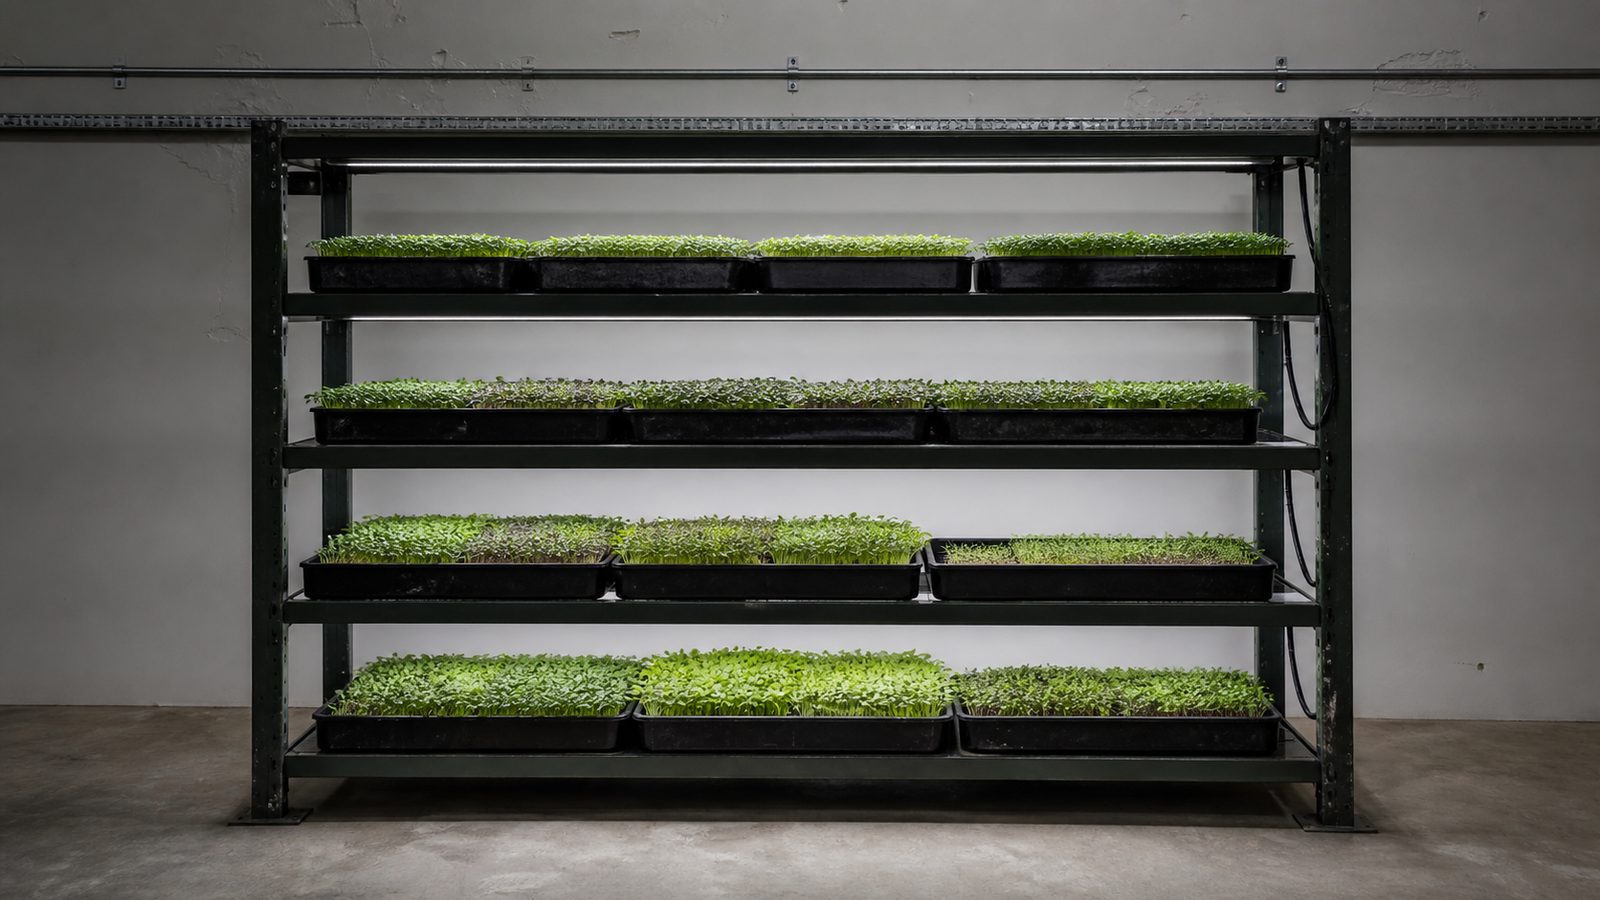
"Uses 90% less water" and "grown locally, so lower carbon" are the two claims this category sells on. Both are testable, and the published evidence answers them in a way neither slogan survives.
Start with the number that makes a category-wide claim impossible. A cradle-to-gate life-cycle assessment of kale microgreens modeled a range of 3.34 to 63.34 kg CO2e per kilogram of fresh product, depending on photoperiod, CO2 and temperature. That is a 19-fold spread within one crop in one modeling exercise.
A separate assessment of broccoli microgreens on a Portuguese university campus put the figure at 18.6 kg CO2e/kg delivered on campus and 22.2 kg/kg delivered to retailers within 10 km. Electricity alone contributed 10.03 and seed 4.04.
So, "indoor microgreens" is not a footprint. It is a range wide enough to contain almost any answer you want, and where you land inside it is decided by things that have nothing to do with the plant.
What to actually do
- Look up your grid before you claim anything. The same system doubled its carbon between two national grids. EPA publishes subregion and state electricity factors, and that number is the single biggest lever you have.
- Never claim a footprint without naming the comparator. "Better than conventional agriculture" is not checkable. "Lower land use per kilogram than field lettuce trucked from another state" is.
- Say irrigation water, not water. The 11.4 liters a kilogram figure is real and it counts the tap only. A "90% less water" claim that ignores embodied water is measuring one input and implying all of them.
- Do not carry a kale figure onto another crop. The seed conversion behind these models is one the median real crop does not reach, and 24 of 39 fall short of it.
- Record yield alongside electricity, every crop. The modeled outcome swung 19-fold on photoperiod, CO2 and temperature, which means your own kWh per kilogram is the only figure that describes your operation.
- Treat local as freshness, not as carbon. Transport is 5 to 6% of food-system emissions. The claim is fine; the reason usually given for it is the wrong one.
- If you want the carbon result to improve, change the electricity. Not the packaging, not the trays, and not the delivery radius. Electricity was the largest contributor in every assessment opened here.
Land and carbon give opposite verdicts, and both are correct
This is the trap. Pick the impact category and you pick the winner.
The closest well-studied comparison is indoor lettuce against field lettuce, which shares the growing method if not the harvest stage:
Hover or tap a row to highlight it.
| Measure | Controlled environment | Field |
|---|---|---|
| Land occupation | 0.0065 m² per year per kg | 0.24 to 0.25 |
| Yield per growing area | 154 kg/m²/year | up to 38 times less |
| Energy | 15 kWh/kg for lighting, cooling, ventilation and pumping | not the comparable burden |
| Carbon on Britain's mixed grid | 8.9 kg CO2e/kg | |
| Carbon on South Africa's coal-heavy grid | 17.8 kg CO2e/kg |
On land, controlled environment wins by roughly 37-fold and it is not close. On carbon, the same system doubles its footprint by moving country, with nothing about the growing changing at all.
That is the whole answer to "is it sustainable". It is not a property of microgreens. It is a property of the electricity you plug the rack into, and a grower in a coal region and a grower on a clean grid are running environmentally different businesses with identical equipment.
Two cautions on that land figure, because it is the one most likely to be quoted out of context. The denominator is facility growing area and annual fresh mass. It is not calories, not nutrients, not the building's footprint, and not the construction materials that went into it.
Calories are the wrong denominator, and nobody has built the right one
A microgreen is a low-calorie garnish crop, so a per-calorie comparison flatters or destroys it depending which way you point it. A system can look outstanding per square foot while contributing almost no dietary energy.
Nutrient delivery is the more relevant denominator and it does not exist yet. Building it needs a matched nutrient functional unit, a standardized cultivar and harvest stage, a defined serving, losses and digestion assumptions. Nobody has published a life-cycle comparison of microgreens against a mature crop per calorie or per matched nutrient delivered.
Nor has anyone compared a microgreen with the mature form of the same crop on a common functional unit and equal system boundary. That is the comparison every seller claim implies and no study has run.
And the sprout comparison is missing too. Sprouts are a plausible lower-input comparator, harvested earlier and commonly grown in water rather than a medium under lights. But "sprouts need no light" is not a lower total footprint: sprouting uses repeated rinsing, sanitation, vessels and refrigeration. What actually separates a sprout from a microgreen is covered separately. No matched assessment of the same seed grown both ways exists.
The water claim is real, much smaller than advertised, and measures one thing
The measured figure is good. In a 2020 experiment, sensor-managed kale microgreens at a 17.5% effective-container-volume setpoint produced 88 g of fresh weight per liter of irrigation water, which is about 11.4 liters per kilogram by reciprocal. The paper's own table reports 80.99 g/L at that treatment against the abstract's rounded 88, and attributes the gap to sensor precision.
What that figure counts is irrigation water over 14 days. What it does not count is everything else: water embodied in the electricity, the seed, the substrate, the trays, the cleaning and the equipment.
And the wider literature warns this is exactly where the claim breaks. Direct water use can fall while upstream water-scarcity impacts rise through LEDs, steel, aluminum and electricity generation. A seller's "90% less water" is measuring the tap, not the system.
Local is a real benefit and a small carbon lever
Transport is about 5 to 6% of food-system emissions. So, moving production next to the buyer addresses a single-digit slice of the total, while the electricity that replaced the sun is the largest line in every microgreen assessment here.
That does not make local worthless. Shorter chains mean fresher product, less spoilage and a shorter cold chain, and those are real. It makes "local, therefore low carbon" a claim about the wrong 5%.
The seller claims are also untestable as written. The evidence papers name their comparator precisely: open field, high-hoop greenhouse, fully controlled hydroponics; or regional, continental and international supply chains. Seller pages generally say only "conventional agriculture". Soil-grown broccoli from the next county, field lettuce trucked across a continent, heated greenhouse basil and air-freighted salad are not the same alternative, and a claim that does not say which one it beat cannot be checked.
The seed assumption in the model beats most real crops
One of the assessments' own assumptions can be checked against real crops.
The kale assessment models 0.07 kg of seed and 3 kg of coconut-fiber substrate per kilogram of fresh microgreens. That seed figure is a conversion rate, and it can be checked against the field.
Hover or tap a row to highlight it.
| Reading | Figure |
|---|---|
| The model's 0.07 kg seed per kg fresh, expressed as a conversion | 14.29 g fresh per g seed |
| Median across the 39 crops publishing both fields | 9.24 g fresh per g seed |
| The model's assumption against that median | 55% better |
| Crops that meet or beat it | 15 of 39 |
| Crops that fall short | 24 of 39 |
| Worst case | fennel, 18 times short |
Seed was the second-largest contributor in the broccoli assessment at 4.04 kg CO2e/kg, behind only electricity. So, for most crops, a model built on that assumption understates the seed line, and understates it on the component that matters second most.
This is not a criticism of the assessment. It modeled kale, and kale is one of the crops that clears the bar. It is a warning against carrying a kale-derived footprint onto a tray of fennel, pea or sunflower, whose conversion is a fraction of it. The full 409-fold seed-rate range sits underneath this.
Waste is modeled, not measured
The documented streams are real: seed, medium, roots, rejected crop, nutrient solution or flush water where a system is not closed, cleaning water and chemicals, packaging, and eventually trays, lights, racking, pumps, filters and climate equipment.
But the one inventory available is a model, not an audit. It assumed plastic sheets, reusable polyethylene trays, cleaning supplies, and a roots-and-substrate co-product sent to compost, and it assumed the closed loop itself produced no waste.
No representative, measured waste inventory across commercial microgreen farms has been published. Settling it needs weigh-and-record audits from multiple growers that separate reusable equipment from one-crop consumables and report actual disposal routes.
What nobody has measured
- A microgreen against the mature form of the same crop, on one functional unit and one system boundary. This is the comparison every marketing claim in the category implies.
- A per-calorie or per-nutrient-delivered comparison of any kind, which for a garnish crop is the denominator that would actually mean something.
- A matched assessment of one seed lot grown as sprouts and as microgreens, metering water, power, cleaning, seed loss, medium, packaging, yield and spoilage on both sides.
- A measured waste inventory across real commercial farms, rather than a single modeled case that assumes its own closed loop is waste-free.
- An all-load kWh per kilogram figure for microgreens specifically. The 15 kWh/kg available is lettuce, and crop duration, density, light recipe, climate and yield all differ.
Terms on this page
Tap a term to see what it means.
Life-cycle assessment. A structured accounting of a product's environmental burdens across defined stages. Its answer depends entirely on the boundary and the functional unit, which is why two assessments of one crop can differ nineteenfold.
Sources
Opened 2026-08-11. The seed-conversion comparison was computed for this page: the modeled 0.07 kg seed per kg fresh inverted to 14.29 g fresh per g seed, set against the median and distribution computed from the seedGramsPer1020 and yieldOuncesPer1020 fields across the 39 of 62 variety entries that publish both. Four sources were opened and are deliberately not used for any factual claim here, because three returned a bot check and one an internal error; they are listed at the foot so the gap is visible rather than silent.
- Parkes et al., 2022, broccoli microgreen life-cycle assessment - a prospective building-integrated indoor vertical farm on a Portuguese university campus, functional unit one kilogram: 18.6 kg CO2e/kg supplied on campus and 22.2 supplied to retailers within 10 km, with electricity contributing 10.03 and seed 4.04. The boundary covers the farm, processing, inputs and the two supply scenarios, and it is not a comparison with field-grown broccoli.
- Dynamic kale microgreen life-cycle assessment, 2023 - cradle-to-gate, including infrastructure, LEDs, seeded trays, water, electricity, CO2, cleaning, compostable biomass and local delivery, modeling a range of 3.34 to 63.34 kg CO2e per kg fresh depending on photoperiod, CO2 and temperature; and the inventory of 0.07 kg seed and 3 kg coconut-fiber substrate per kg fresh, plus plastic sheets, reusable polyethylene trays, cleaning supplies and a roots and substrate co-product to compost, with the closed loop assumed to produce no waste.
- Tavan et al., 2020 - sensor-managed kale microgreens across five irrigation levels over 14 days: 88 g fresh weight per liter at the 17.5% effective-container-volume setpoint in the abstract against 80.99 g/L in the table, attributed to sensor precision, and 1.89 kg/m² fresh yield.
- Lee et al., 2022, comparative environmental footprints of lettuce (PDF) - controlled-environment lettuce at 154 kg/m²/year and 0.0065 m²-year/kg land occupation against 0.24 to 0.25 for field, up to 38 times less land per kilogram, 15 kWh/kg for lighting, cooling, ventilation and pumping, and 8.9 kg CO2e/kg on Britain's mixed grid against 17.8 on South Africa's coal-heavy grid; comparators named as regional, continental and international field supply chains.
- Banboukian, Chen and Thomas, 2025 - a lettuce assessment naming its comparators explicitly as open field, high-hoop greenhouse and fully controlled hydroponics, which is the practice the seller claims do not follow.
- EPA eGRID 2023 summary tables (PDF) - subregion and state electricity CO2e factors, created 27 March 2025. The dataset behind the advice to look up your own grid.
- Our World in Data, food miles - transport at 5 to 6% of food-system emissions.
- Drexel indoor urban gardening pilot, 2025 - an implemented university cart and its stated limitations, cited as a description of what was built rather than as outcome evidence.
- Practice, seller pages opened 2026-08-11 as a record of what is claimed rather than as evidence: Soil Less Microgreens, selling local living microgreens with less-water, less-land and local-pollution claims against an undefined comparator; Joe's Microgreens, a farm and compost-hauling business's sustainability framing; and Verdánt Organics, the source of the "90% less water" claim.
- Opened and NOT used for any factual claim, recorded so the gap is visible: an MDPI article page, which returned an internal error and whose abstract was taken from the DOAJ record above instead; and three papers that returned a reCAPTCHA bot check, on resource-use efficiency, continuous lighting and sprouts against microgreens.
Keep reading
The journal
Buying a Microgreens Business for Sale: What to Check First
Thinking about a microgreens business for sale? Learn how sellers state cash flow, what SBA loans require in 2026, and what to check before you buy.
Read Buying a Microgreens Business for Sale: What to Check FirstThe journal
Growing Microgreens for Profit: A Weekly Production Plan
Plan growing microgreens for profit with tray counts per crop, a buffer from your own records, and a weekly sowing and harvest schedule you can repeat.
Read Growing Microgreens for Profit: A Weekly Production PlanThe journal
How to Write a Microgreens Business Plan Step by Step
Build your microgreens business plan section by section, from executive summary to financial plan, with startup costs itemized by scale and source.
Read How to Write a Microgreens Business Plan Step by StepThe journal
Microgreen Growers Insurance: Costs, Limits and Markets
Selling microgreens at a market or restaurant? See what microgreen growers insurance covers, who requires it, and what policies cost by limit, state and year.
Read Microgreen Growers Insurance: Costs, Limits and Markets