What Does a Tray Actually Yield? The Range Is 18-Fold and the Reason Is Not the Crop
Cal HewittPublished Checked
- yield
- evidence
- business planning
- growing
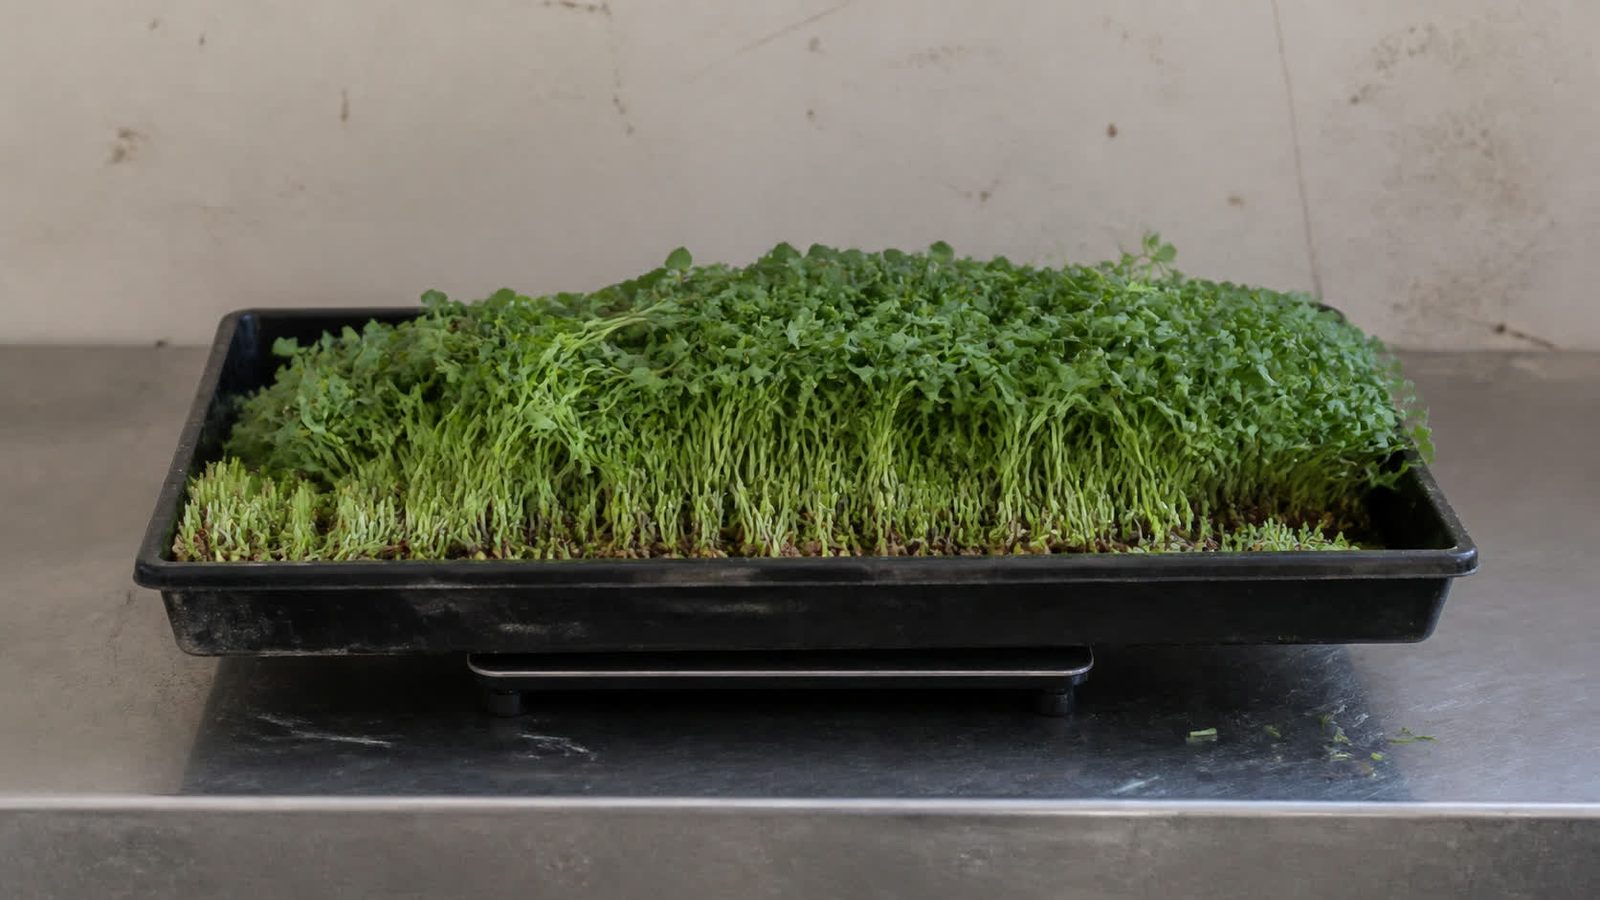
A tray does not have a yield. It has a yield under conditions, and almost nothing published states them.
What to actually do
- Weigh your own trays. It is the only figure that describes your system, and for 23 of the 62 crops here there is no published alternative.
- Weigh several. One tray is an anecdote; the medium experiment alone moved pea yield 4.4-fold.
- Record the nine conditions below when you do, or your own number will be as unusable next year as everyone else's is now.
- Do not carry a catalog figure across to an unusual crop. The commercial range is narrow because the low yielders were selected out before the catalog was printed.
- Check whether a figure is fresh or dry before comparing it to anything. They differ by roughly ten to twenty-five times.
- Treat a per-square-meter figure and a per-tray figure as different units and convert deliberately, using the tray's real inside area.
- Expect the medium to matter about as much as the crop, on the only two experiments that isolated either.
The published range, and how wide it really is
Of the 62 crops here, 39 carry a published yield and 23 do not.
Hover or tap a row to highlight it.
| Crop | Yield per 1020 | |
|---|---|---|
| Highest | Sunflower | 18.77 oz |
| Lowest | Fennel | 1.00 oz, area-converted |
| Spread | 18.8-fold |
Now set that against the largest external source. A seed company's 2017 averages across 29 crops run from 5.5 oz for a red basil to 15 oz for Tokyo Bekana, a 2.7-fold range.
The 18.8-fold range is nearly seven times wider, and the reason is which crops each list contains. A seed catalog lists crops it sells for microgreens, and the commercial world has already selected out the ones that return an ounce a tray. A catalog's yield range describes a filtered set, and a grower choosing an unusual crop is outside the filter.
That seed company is also the most honest source in the category on method. It states the tray size, the grams of seed, the first-true-leaf stage, the days, the medium, at least three sowings, and that it ran in a greenhouse with seasonal variation. It still does not state light, temperature, cut height or cleaning.
Crop explains a lot. So does the medium.
One controlled system grew 17 crops and reported 409.3 to 2,258.8 grams per square meter, a 5.5-fold span from crop alone with everything else held fixed.
Then a separate 2023 experiment varied only the medium, and the swing was almost as large:
- Pea: 0.99 to 4.37 kg/m² across media, a 4.4-fold range.
- Radish: 1.51 to 3.72 kg/m², 2.5-fold.
- A 50:50 peat-perlite plus compost gave 3.72 kg/m² for both, which for radish was a 39.8 percent increase over peat-perlite alone at 2.66.
- 100 percent spent mushroom compost did not germinate at all and was not harvested.
Read those two together and the problem is obvious. Crop moves yield 5.5-fold. Medium moves it up to 4.4-fold. Nobody in the opened evidence decomposes crop, density, light, temperature and medium in one design, so no published figure tells you how much of it is the plant.
Seed rate has been tested and the answer is bounded. A 2013 experiment found the 1x commercial rate maximized fresh yield per square meter for table beet at 202 g/m², arugula at 55 and amaranth at 83, among rates of 0.25, 0.5, 0.75 and 1.0x. That is a maximum within the range tested, not a demonstrated biological optimum, because nothing above 1x was tried.
Fresh and dry weight are different products
This is the trap that makes cross-source comparison unsafe.
Dry matter across a 2023 multi-crop trial ran from 38.55 g/kg fresh weight in broccoli to 94.34 in sunflower, mean 56.90. That is 3.855 to 9.434 percent of fresh mass.
So, a 100 gram fresh harvest is roughly 4 to 9 grams of dry material, depending on the crop, and a dry-weight yield figure and a fresh-weight one differ by more than an order of magnitude. Dropping that distinction on nitrate does the same damage in a different context: one result converts to anywhere between 1,045 and 11,307 mg/kg depending on which dry matter you assume.
Any yield figure without its basis stated is unusable, and most of them do not state it.
What a figure has to carry to mean anything
Nine things, and almost nothing published carries half of them:
- Tray size and its actual inside area
- Seed rate, in grams
- Harvest stage, not just a day count
- Cut height
- Fresh or dry weight
- Light, as intensity and photoperiod
- Temperature
- Medium
- Whether hulls and debris were removed before weighing
That last one is a real mass, not a technicality, and no source in this category states a cleaning rule.
What nobody has measured
- A decomposition of crop, density, light, temperature and medium in one design, which is what would make any published yield transferable.
- Marketable yield after a stated cleaning rule, from any source.
- A yield for 23 of the 62 crops here, including several that are commonly sold.
- Anything above the 1x commercial seed rate, so the tested optimum is a boundary rather than a peak.
- An independent commercial grower's tray yields. The best public figures come from a seed seller's research farm and a vendor's target.
- Yield paired with the seed cost of the same tray, which is the number that would answer whether a crop is worth growing.
Terms on this page
Tap a term to see what it means.
Fresh weight. The mass of the crop as harvested, water included. What a grower sells and what a price is set on.
Sources
Opened 2026-08-12. The count of 39 crops with a published yield, the 18.8-fold spread and the comparison against the seed catalog's range were computed for this page on 2026-08-12, from the canonical comparison table and confirmed against the per-crop field on every entry.
- Di Gioia and colleagues, 17 microgreen species, 2023 - the 409.3 to 2,258.8 grams per square meter range across 17 crops under one disclosed system, and the dry matter range of 38.55 g/kg fresh weight in broccoli to 94.34 in sunflower with a mean of 56.90.
- Poudel and colleagues, growing media for microgreens, 2023 - pea fresh weight of 0.99 to 4.37 kg/m² and radish 1.51 to 3.72 across media, the 50:50 peat-perlite plus compost result of 3.72 for both and the 39.8 percent radish increase over peat-perlite at 2.66, the failure of 100 percent spent mushroom compost to germinate, and the three replicates.
- University of Delaware thesis, seeding rate in microgreens, 2013 (PDF) - the 1x commercial rate maximizing fresh yield per square meter for table beet at 202 g/m², arugula at 55 and amaranth at 83, among rates of 0.25, 0.5, 0.75 and 1.0x.
- Johnny's Selected Seeds microgreens yield trial - the 29-crop 2017 averages running from 5.5 oz per 1020 for Red Rubin basil to 15 oz for Tokyo Bekana, stated with tray size, grams of seed, first-true-leaf stage, days, medium, at least three sowings and greenhouse conditions, and without light, temperature, cut height or cleaning.
- Paperpot Co, arugula microgreens grower notes, 2022 (PDF) - the 320 gram standard-1020 arugula target attributed to Scintilla Farms, with an estimated three 105 gram clamshells a tray.
- OZO Microgreens retail catalog - practice only, and cited to make the point that a retail price of $11 per 2 oz for shiso against $5 for broccoli says nothing about seed cost or production cost. Prices observed 2026-08-12.
Keep reading
The journal
Microgreens Yield per Square Foot, Crop by Crop
Sizing a shelf or rack? Compare microgreens yield per square foot by crop, then weigh your own trays and divide by their real floor area, not a guess.
Read Microgreens Yield per Square Foot, Crop by CropThe journal
Are Microgreens Sustainable? The Published Range Is 3.34 to 63.34 kg CO2e a Kilo, and Your Grid Decides Where You Land
One modeled crop spans a 19-fold carbon range. Indoor growing beats field lettuce on land by roughly 37 times and can lose on carbon, because the answer is a property of your electricity rather than of the crop.
Read Are Microgreens Sustainable? The Published Range Is 3.34 to 63.34 kg CO2e a Kilo, and Your Grid Decides Where You LandThe journal
Is Homegrown Safer? What the Produce Recalls Actually Change
Partly, and not for the reason people think. Growing your own does not remove contamination risk, it moves it onto seed, substrate and water, which are three things you can act on. And one tray is one to two days of one adult's vegetables, not a replacement.
Read Is Homegrown Safer? What the Produce Recalls Actually ChangeThe journal
What Is a Microgreen? A Young Seedling, Cut Above the Soil at First True Leaf
A young edible seedling, grown densely and cut above its medium at about the first true leaf, usually 1.5 to 3 inches and 7 to 21 days. That cut is what separates it from a sprout.
Read What Is a Microgreen? A Young Seedling, Cut Above the Soil at First True Leaf