The Healthiest Microgreens: Which Are Most Nutritious, and Why the Ranking Collapses
Cal HewittPublished Checked
- comparison
- nutrition
- buying
- beginner
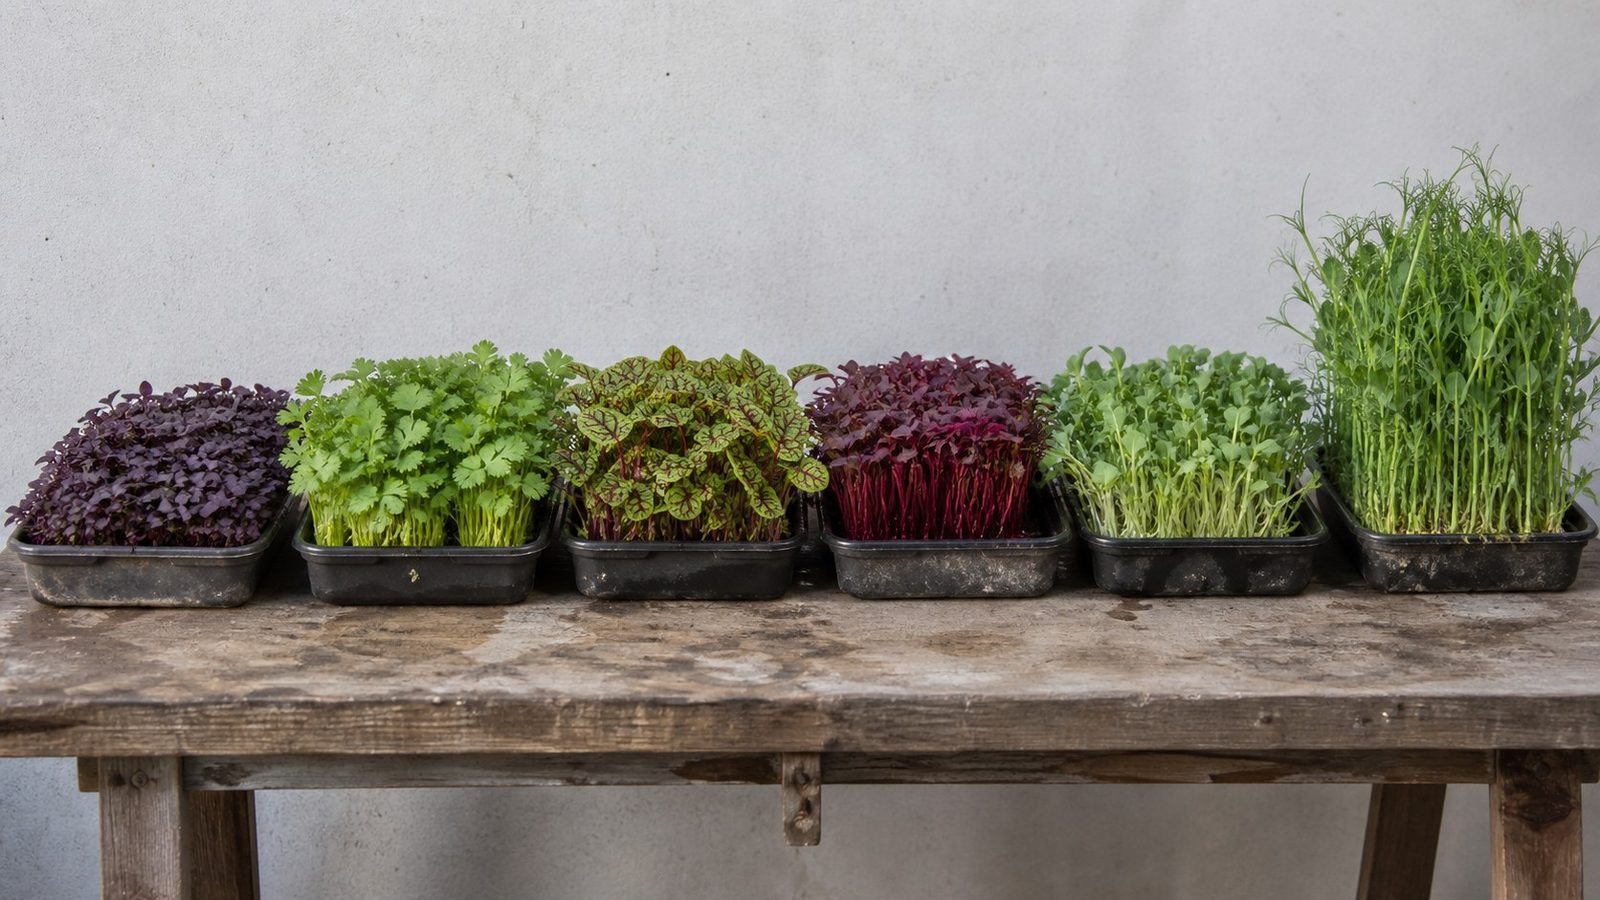
Here is the closest thing to an answer, from the broadest dataset anybody has published. Across 25 commercially grown varieties measured in one study: red cabbage led vitamin C, red sorrel led beta-carotene, cilantro led the other two carotenoids, and green daikon radish led both forms of vitamin E. Four different crops, four different compounds.
That is the whole problem with the question. No crop led everything, and the leader changes with the compound, the cultivar, the light, the substrate, the harvest stage, the water basis and the amount you actually eat. There is no published, matched-conditions, per-serving comparison that would support naming one microgreen the healthiest.
So, pick the compound you care about and choose for that. And the reason that is not a dodge is what happens when you convert the best available dataset into the serving a person actually eats: the ranking does not survive the conversion, and at a real 2.5 g serving the gap between first and third for beta-carotene is fifteen micrograms.
What to actually do
- Pick a compound, not a crop. "Most nutritious" has no measurable meaning. "Highest measured vitamin C under these conditions" does, and the answer to that was red cabbage.
- If vitamin C is the aim and your crop resembles that study's sample, red cabbage seed is the one with a direct measured result behind it. That is a compound-specific statement and not a claim that red cabbage is the healthiest microgreen.
- Weigh what you eat before you compare crops. A 2.5 g garnish is a fortieth of the quantity every published figure is written against, and it collapses most of the differences being argued over.
- Ignore any podium narrower than about 10%. In this dataset the top three for beta-carotene sat 5.2% apart, inside the noise from moisture, light and cultivar.
- Read the basis before you read the ranking. Fresh weight rewards the drier crop, and the moisture spread here was 23 times the gap it was deciding.
- Treat cultivar as part of the crop name. Two radish cultivars in one experiment led different compounds and differed in dry matter almost as much as 25 different crops did.
- Choose something you will actually eat repeatedly. Amount eaten moves your intake far more than crop identity does, and a crop you dislike delivers nothing.
- A small mix is a reasonable hedge, and not a proven upgrade. Different crops led different compounds, so a mix spreads the bet. No mixture study exists, and at equal total mass a mix dilutes one crop's leading compound while adding another.
In one study, four different crops led four different compounds
The broadest dataset available measured 25 commercially grown named varieties for total, free and dehydro ascorbic acid, beta-carotene, lutein and zeaxanthin, violaxanthin, phylloquinone and alpha- and gamma-tocopherol, all reported per 100 g fresh weight.
Hover or tap a row to highlight it.
| Compound | Leader | Figure |
|---|---|---|
| Total ascorbic acid, vitamin C | Red cabbage | 147.0 mg per 100 g |
| Beta-carotene | Red sorrel | 12.1 mg per 100 g |
| Lutein and zeaxanthin | Cilantro | 10.1 mg per 100 g |
| Violaxanthin | Cilantro | 7.7 mg per 100 g |
| Phylloquinone, vitamin K1 | Garnet amaranth | 4.1 µg per g |
| Alpha-tocopherol, vitamin E | Green daikon radish | 87.4 mg per 100 g |
| Gamma-tocopherol | Green daikon radish | 39.4 mg per 100 g |
No crop led vitamin C, K1, beta-carotene and the tocopherols together. Cilantro led two of the three named carotenoid measures and lost the third.
Red sorrel led beta-carotene, not cilantro, at 12.1 against cilantro's 11.7 and red cabbage's 11.5, though summaries of this study routinely name cilantro the carotenoid leader. Cilantro's wins were lutein and zeaxanthin, and violaxanthin.
And a second study finds different leaders again. Among four hydroponic brassicas measured under one protocol, kale was highest in total polyphenols, mustard and radish highest in total isothiocyanates, and mustard highest in total carotenoids on that study's dry-weight basis. Different panel, different leaders.
Convert it to a real serving and the ranking collapses
The whole table above is written against 100 grams of fresh microgreens. Nobody eats that.
The only weighed serving anybody publishes is 2.5 grams a person, which is one fortieth of the reference quantity the entire literature is denominated in. Convert the leaders and the picture changes completely.
Hover or tap a row to highlight it.
| Crop and compound | Per 100 g | At a 2.5 g serving |
|---|---|---|
| Red cabbage, vitamin C | 147.0 mg | 3.68 mg |
| The lowest crop in the same table, vitamin C | 20.4 mg | 0.51 mg |
| Green daikon radish, alpha-tocopherol | 87.4 mg | 2.19 mg |
| Green daikon radish, gamma-tocopherol | 39.4 mg | 0.99 mg |
| Red sorrel, beta-carotene | 12.1 mg | 0.30 mg |
| Cilantro, lutein and zeaxanthin | 10.1 mg | 0.25 mg |
| Cilantro, violaxanthin | 7.7 mg | 0.19 mg |
| Garnet amaranth, vitamin K1 | 410 µg | 10.25 µg |
The entire distance between the best and worst crop in that study for vitamin C, at a real serving, is 3.17 mg.
And the beta-carotene podium is the number that ends the argument. First place was 12.1 mg per 100 g and third place was 11.5. At a 2.5 g serving that is 0.3025 mg against 0.2875 mg.
Fifteen micrograms separates first from third.
Those three crops are 5.2% apart, which is a gap you could produce by harvesting a day later, using a different lamp, or picking a different cultivar of the same crop. It is not a ranking. It is noise with an order imposed on it.
The fresh-weight basis is partly a ranking of which crop holds less water
This is the confound sitting inside that same table, and it is much larger than the gaps it is being used to decide.
The 25 crops ranged from 4.6% to 10.2% dry matter, mean 6.9%. So 100 g of the driest crop contains 10.2 g of actual plant and 100 g of the wettest contains 4.6 g.
Hover or tap a row to highlight it.
| Quantity | Size |
|---|---|
| Dry-matter range across the 25 crops | 4.6% to 10.2%, a 2.22-fold spread |
| The beta-carotene podium, first to third | 5.2% |
| The confound, as a multiple of the podium gap | about 23 times |
A per-fresh-weight ranking rewards the drier crop, because more of its 100 grams is plant. The moisture spread in this dataset is roughly 23 times the gap it is being used to settle. Any ordering where crops finish within a few percent of each other is being decided by water content before it is decided by nutrition.
You cannot fix this by converting with a generic moisture figure. Conversion needs each sample's own dry-matter fraction: concentration per gram dry weight equals concentration per gram fresh weight divided by the dry-matter fraction. The study publishes enough dry-matter data to do that for itself, and it does not publish a recalculated ranking on a dry basis.
Mixing bases across studies is worse. The four-brassica study reports vitamin C on fresh weight and total carotenoids in beta-carotene equivalents per 100 g dry weight, in the same paper. Setting its carotenoid figures beside the 25-crop study's carotenoid figures, as though they shared a basis, is not a comparison.
The conditions were not matched, so the crop is not the only variable
Calling this a crop ranking requires the crops to be the thing that differed. In the 25-crop study they were not.
- 23 crops were soil-grown in an unheated, ambient-light greenhouse.
- China rose and green daikon radish were hydroponic.
- Golden pea tendrils and popcorn were dark-grown.
- Harvest age varied by species, and all of it came from one grower and one analytical lab.
The authors point at the cleanest illustration themselves. Golden pea tendrils and green pea tendrils were the same seed source, one grown in light and one in darkness, and the dark-grown sample was among the low carotenoid and K1 results. That is a lighting result presented in a crop table, and it is a direct warning against reading any row as a property of the plant.
So, the honest wording is narrow: under these stated commercial conditions, this sample was higher for this analyte. Not: this microgreen is healthier.
Cultivar can reverse the answer inside a single crop
"Radish" is not a specification, and a study that held everything else constant proves it.
Five radish cultivars, tray-grown without substrate under artificial light and harvested at day 10:
- 'Asia red' had the highest vitamin C, at 236.27 mg per 100 g dry weight.
- 'Koregon red' had the highest total phenolics, at 280.53 mg per 100 g as that study reported it, plus high flavonoids.
- Glucoraphasatin and glucoraphanin proportions differed sharply among the five.
- Dry matter ran 4.75% to 7.65% across cultivars of one crop, which is most of the spread the 25-crop study found across 25 different crops.
A separate three-cultivar experiment reached the same place from the light side, finding that cultivar and LED type both moved phenolics, ascorbic acid, pigments and antioxidant capacity.
A page that tells you to buy "radish" has not told you which of these you are getting. Meanwhile a controlled four-brassica study found genotype was the principal source of variation, with harvest-stage effects limited and themselves genotype-dependent: beta-carotene showed no stage response while lutein and ascorbate responses varied by genotype.
Bioaccessibility is not absorption, and it varies more than the concentrations do
Concentration in the leaf is not the amount that reaches you.
The four-brassica study ran simulated gastrointestinal digestion and found sharply different accessible fractions:
Hover or tap a row to highlight it.
| Crop | Vitamin C | Total isothiocyanates |
|---|---|---|
| Broccoli | 1.10% | 32.30% |
| Kale | 1.87% | 34.06% |
| Mustard | 3.73% | 31.07% |
| Radish | 2.61% | 63.36% |
Mustard's accessible vitamin C fraction is 3.4 times broccoli's, and radish's accessible isothiocyanate fraction is roughly double the other three. Those spreads are far larger than the concentration gaps the ranking pages argue over.
But this is a digestion model, not people. It measures bioaccessibility, what is released and potentially available, not bioavailability, what a human actually absorbs and uses. No study located measures human absorption by microgreen crop. Settling that needs randomized feeding studies with characterized batches and blood or urine biomarkers.
What the popular "healthiest" lists are based on
Four "healthiest microgreens" pages were opened and audited on 2026-08-11.
Zero of four supplied an auditable matched study supporting the ordering itself, at the point where the ordering was claimed. One opened with arugula, one gave a top-ten-style guide and the "up to 40 times" wording, one listed seven "healthiest" crops in a home-growing guide, and one named broccoli "king of nutrients" with a comparison table lacking the conditions needed to compare its own inputs.
None of them published, next to its ranking, the cultivar, harvest stage, growth conditions, fresh or dry basis, a common serving, and the calculation converting measurements into that order. That is four pages, chosen and dated, not a census of the web.
Broccoli is the most common explicit number one, usually justified with general brassica reputation and glucosinolate language rather than a matched cross-crop per-serving score. That describes what gets published. It is not evidence that broccoli wins.
The "up to 40 times" line does its usual work here too. It is a maximum, analyte-specific and comparator-specific statement about microgreens against mature counterparts, and it is used to support a healthiest-microgreen message it cannot address at all, because it says nothing about how microgreens rank against each other. Where that figure came from takes it apart.
A second recurring error is treating microgreens and sprouts as interchangeable, which FDA's rule explicitly does not, and what actually separates the two is covered in full separately.
What nobody has measured
- A matched multi-crop panel: one named cultivar set, grown and harvested together, comprehensive validated assays reported on both fresh and dry weight, with a pre-specified scoring rule declared before the data is seen.
- A comprehensive compound panel. The available datasets do not jointly cover B vitamins, protein and amino acid quality, fatty acids, fiber, sugars, sodium, oxalate, phytate, nitrate and contaminants across one representative crop set. Absence from a panel is not absence from the plant.
- A per-serving cross-crop comparison using a consumer-tested serving mass and equal fresh-weight servings, including handling losses.
- Human bioavailability by crop. Everything published is in-vitro digestion.
- Whether a mix beats a single crop at equal total serving mass, for delivery, acceptability and absorption.
- A census of the unmeasured crops. Sunflower, wheatgrass, chive and onion, fennel and most branded mixes have no crop-specific matched multi-nutrient profile. That is a gap in the literature, and it is not a finding about those crops.
Terms on this page
Tap a term to see what it means.
Fresh weight. The concentration in the food as eaten, water included. The basis nearly every headline microgreen figure uses, and the one that rewards a drier crop.
Sources
Opened 2026-08-11. The serving conversions were computed for this page: each published per-100-g fresh-weight concentration multiplied by 2.5 g and divided by 100, using the only weighed serving in circulation. The vitamin K1 row converts 4.1 µg per g to 410 µg per 100 g first. The 23-fold confound figure divides the dataset's own dry-matter spread by its own beta-carotene podium gap. None of these conversions introduces an outside number, and none of them is a recommended intake.
- Xiao, Lester, Luo and Wang, 2012, vitamin and carotenoid concentrations of edible microgreens (PDF) - 25 commercially grown named varieties at cotyledon or very early true-leaf stage, reported per 100 g fresh weight: red cabbage leading total ascorbic acid at 147.0 mg, red sorrel leading beta-carotene at 12.1 with cilantro at 11.7 and red cabbage at 11.5, cilantro leading lutein and zeaxanthin at 10.1 and violaxanthin at 7.7, garnet amaranth leading phylloquinone at 4.1 µg per g, and green daikon radish leading alpha- and gamma-tocopherol at 87.4 and 39.4 mg; the lowest reported total ascorbic acid of 20.4 mg per 100 g; dry matter of 4.6 to 10.2% with a mean of 6.9%; and the methods showing 23 crops soil-grown in an unheated ambient-light greenhouse, China rose and green daikon radish hydroponic, golden pea tendrils and popcorn dark-grown, and the golden and green pea tendrils sharing a seed source under dark and light. This is the same 2012 study cited on the baby greens comparison and on the 40 times page, reached there through a different hosted copy.
- de la Fuente et al., 2019, four hydroponic Brassicaceae microgreens - broccoli, curly kale, red mustard and radish under one protocol, measuring minerals, vitamin C, total carotenoids, polyphenols, anthocyanins, isothiocyanates and simulated-digestion bioaccessibility; kale highest in total polyphenols, mustard and radish highest in total isothiocyanates, mustard highest in total carotenoids on that study's dry-weight basis; vitamin C bioaccessibility of 1.10% broccoli, 1.87% kale, 3.73% mustard and 2.61% radish, and total isothiocyanate bioaccessibility of 32.30%, 34.06%, 31.07% and 63.36% respectively; and the mixed reporting, with vitamin C on fresh weight and total carotenoids per 100 g dry weight.
- Kim et al., 2023, five radish cultivars - 'Asia green 1', 'Asia green 2', 'Asia red', 'Koregon red' and 'Asia purple' tray-grown without substrate under artificial light and harvested at 10 days: 'Asia red' highest in vitamin C at 236.27 mg per 100 g dry weight, 'Koregon red' highest in total phenolics at 280.53 mg per 100 g with high flavonoids, sharply differing glucoraphasatin and glucoraphanin proportions, and dry matter ranging 4.75 to 7.65%.
- Kyriacou et al., 2021, four Brassicaceae types at two stages - komatsuna, mibuna, mizuna and pak choi under controlled conditions, measuring yield, minerals, carotenoids, phenolics and anthocyanins, ascorbate and antioxidant capacity; genotype as the principal source of variation, with first against second true-leaf effects limited and genotype-dependent, beta-carotene showing no stage response, and lutein and ascorbate responses varying by genotype.
- Johnson et al., 2020 and 2021, six species against mature counterparts - arugula, broccoli, red cabbage, red beet, red amaranth and pea compared by non-targeted metabolomics and ionomics across 26 minerals, demonstrating different profiles rather than an overall winner.
- Three radish cultivars under two LED spectra - grown at 24 °C on a 16 hour and 8 hour photoperiod, concluding that cultivar and LED type both affect phenolics, ascorbic acid, pigments and antioxidant capacity.
- Six-species comparison, mungbean, lentil, red radish, pearl millet, mustard and red cabbage - phenolics, anthocyanins, vitamin C, fiber, phytic acid and DPPH activity, useful for a narrow assay comparison rather than an overall nutrient score.
- FDA, guidance for industry on sprouts (PDF) - the distinction between substrate-grown microgreens cut above the substrate and sprouts, for sprout-specific Produce Safety Rule coverage.
- Practice sample, four ranking pages opened and audited 2026-08-11 as a record of what is published rather than as evidence, and the source of the zero-of-four count: The Wonderful World of Sprouts, which opens its order with arugula; Microgreens World, which repeats "up to 40 times" alongside a generic rank; Clean Eating Kitchen, a seven-crop home-growing list labeled "best"; and Total Gardener, which names broccoli "king of nutrients" and presents a comparison table without the conditions needed to compare its inputs.
Keep reading
The journal
Best Tasting Microgreens: 233 Consumers Ranked Them, and Bull's Blood Beet Won
Preference has been measured on 233 consumers across three panels. Bull's Blood beet topped the only 0-to-100 ranking, pea shoots and Swiss chard led the other two, and milder crops won throughout.
Read Best Tasting Microgreens: 233 Consumers Ranked Them, and Bull's Blood Beet WonThe journal
Microgreens vs Baby Greens: Same Seed, Same Tray, and the Only Difference Is When You Cut
These are harvest stages of one plant, not three foods. USDA and Maryland disagree on where microgreens end, 17 of 61 crops with a published harvest window break the day counts, and the yield result everyone cites is a density experiment.
Read Microgreens vs Baby Greens: Same Seed, Same Tray, and the Only Difference Is When You CutThe journal
Microgreens vs Sprouts: The Difference Is a Cut, Not a Nutrient, and It Decides Which Federal Rule Applies
A sprout is eaten whole, a microgreen is cut above its roots, and that cut decides whether FDA's sprout rule applies. The nutrition claim used to rank them was measured on mature vegetables.
Read Microgreens vs Sprouts: The Difference Is a Cut, Not a Nutrient, and It Decides Which Federal Rule AppliesThe journal
Microgreens Equipment List: What to Buy at Every Scale
See a microgreens equipment list priced at three scales, from one windowsill tray to a full rack, with what to buy, skip, or borrow from the kitchen.
Read Microgreens Equipment List: What to Buy at Every Scale